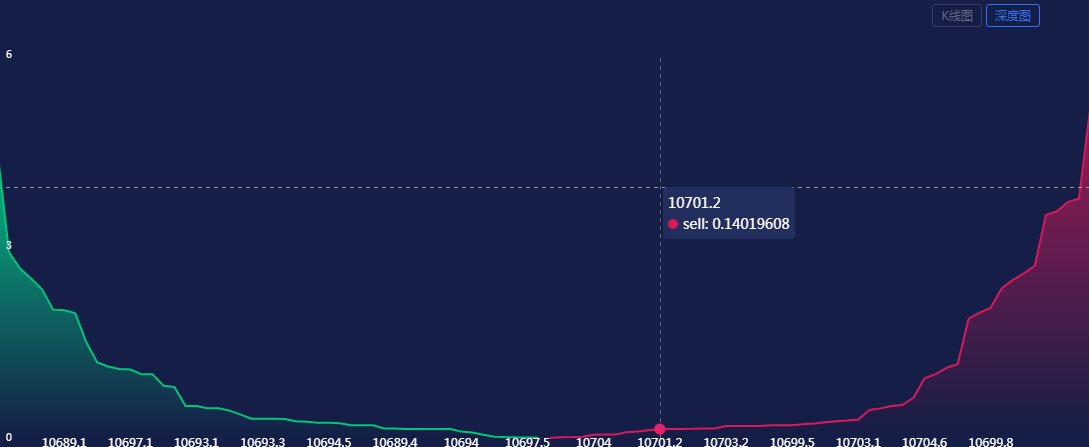
以前的一个项目,需要在网页上对买入卖出的数据实现深度图功能,当时做了比较久的时间,因为网上的教程太过于随意,基本上没有什么注意事项什么的,导致后面坑一大堆,很多都只是弄好了,也不知道它为什么好的,为什么又坏了。所以在今天摸坑全部完成之后,还是在这里写篇文章作为记录吧。
效果如下:

1.首先要在项目里引入echarts
<script type="text/javascript" src="https://cdn.jsdelivr.net/npm/echarts/dist/echarts.min.js"></script>
2.给一个显示深度图的html区域
<div id="k_container"></div>
3.比如我有这样的数据:
{
    "asks": [
        ["10688.9", "4.64068215", "12"],
        ["10689", "0.1", "1"],
        ["10689.1", "0.17", "1"],
        ["10689.4", "0.03337818", "2"],
        ["10689.5", "0.25", "1"],
        ["10689.6", "0.201", "2"],
        ["10689.7", "0.28777592", "3"],
        ["10689.8", "1.9253761", "3"],
        ["10690.1", "0.31", "2"],
        ["10690.3", "2.003", "3"],
        ["10690.6", "0.5", "1"],
        ["10690.9", "1.1", "2"],
        ["10691", "0.20111165", "2"],
        ["10691.2", "2.0676", "1"],
        ["10691.3", "1.2", "2"],
        ["10691.4", "0.2", "1"],
    ],
    "bids": [
        ["10688.8", "0.258", "2"],
        ["10688.1", "0.19427671", "2"],
        ["10687.7", "2", "1"],
        ["10687.6", "0.01", "1"],
        ["10687.2", "0.02", "1"],
        ["10686.8", "0.18698433", "1"],
        ["10686.6", "0.96", "1"],
        ["10686.5", "0.936", "1"],
        ["10686.2", "0.465", "1"],
        ["10686", "0.7", "2"],
        ["10685.7", "0.15", "1"],
        ["10685.6", "1.2", "2"],
        ["10685.5", "0.11005049", "2"],
        ["10685.4", "1.11774854", "2"],
        ["10685.3", "0.98277445", "2"],
        ["10685.2", "1", "1"],
        ["10685.1", "1.5803824", "3"],
        ["10685", "0.2", "1"],
        ["10684.9", "0.6", "2"],
        ["10684.8", "1.44", "2"],
    ],
}
里面包含asks和bids两个数组字段,内容是价格,数量,深度。正常情况下,它的顺序是没有讲究也没有什么从小到大,从大到小这样的区别。但是深度图的要求是,首先要根据数量进行排序,然后asks和bids不能出现价格相同的数据,这样处理完的数据,才可以正常的显示深度图。
4.所以需要两个比较实用的方法。
数组排序,从大到小(以下方法是根据数组内容第一个字段进行排序)
function sortarr(list){
    function sortNumbersub(a,b){
        return Number(b[0])-Number(a[0]);
    }
    list.sort(sortNumbersub)
    return list;
}
数组去重复
function unique(arr) {
    let newArr = [arr[0]];
    for (let i = 1; i < arr.length; i++) {
        let repeat = false;
        for (let j = 0; j < newArr.length; j++) {
            if (arr[i] === newArr[j]) {
                repeat = true;
                break;
            }else{

            }
        }
        if (!repeat) {
            newArr.push(arr[i]);
        }
    }
    return newArr;
}
5.开始对数组进行处理(我这里拆开讲解,实际项目可以全部合并)
正常情况下,真实的交易中,买卖价格相同的数据会直接达成交易,所以基本不会出现。所以一般的重点只在于排序和去除无关数据。
所以,首先需要一个方法,引入买卖数据,然后去除暂时无用的第三位,并且通过reverse()方法倒序内容,让数量显示在第一位。然后,就可以进入K_chart深度数据最后的处理和渲染方法。
function depthMe(arr1,arr2){
    var bids = [];
    var asks = [];

    for (var i = 0; i < arr1.length; i++) {
        bids.push(arr1[i].splice(0,2).map(Number).reverse());  //取数组内容前两位,再倒序,变为数量排在前面用来作为排序字段。

    }
    for (var i = 0; i < arr2.length; i++) {
        asks.push(arr2[i].splice(0,2).map(Number).reverse());
    }
    K_chart(bids,asks)
}
在渲染成统计图渲染之前,最后再处理一次。
function K_chart(bids,asks){
    var bids = sortarr(bids)   //以数量从小到大排序
    var asks = sortarr(asks).reverse();   //排序之后再倒过来,变成从大到小
    arr1 = [];
    arr2 = [];
    for (var i = 0; i < bids.length; i++) {
        arr1.push(bids[i].splice(0,2).reverse());   //将价格重新变为内容数组第一位
    }
    for (var i = 0; i < asks.length; i++) {
        arr2.push(asks[i].splice(0,2).reverse());
    }
    //最终得出的arr1和arr2就可以去用来渲染深度图了
}
6.深度图代码
处理完的数据,就可以传入其中,渲染到页面上
var dom = document.getElementById("k_container");
    var myChart = echarts.init(dom);
    var app = {};
    option = null;
    option = {
       backgroundColor: '#141E46',
        title: {
            text: ''
        },
          tooltip : {
                trigger: 'axis',
                position: function (point, params, dom, rect, size) {
                    return [point[0], point[1]];
                },
                backgroundColor:"#222E5D",
                axisPointer: {
                    type: 'cross',
                    lineStyle:{
                        color:'#60698D',
                        type:'dashed'
                    },
                    label: {
                        show:false,//坐标指示器
                        fontSize:11,
                        backgroundColor: '#222E5D',
                    }
                }
            },
            grid: {
                containLabel: true,
                left: '0%',
                right: '0%',
                bottom: '0%'
            },

        grid: {
            containLabel: true,
            left: '0%',
            right: '0%',
            bottom: '0%'
        },
        textStyle:{
            color:'#fff'
        },
        animation:false,
        xAxis :
            {
                type : 'category',
                boundaryGap : false,
                min: 'dataMin',
                axisLine:{
                    lineStyle: {
                        color: "transparent"
                    }
                },
                 axisLabel: {
                    margin: 0,
                    align: "center",
                    showMaxLabel:false,
                    showMinLabel: false//不显示X轴最小刻度
                },
                show:true
            }
        ,
        yAxis :
            {
                splitNumber:2,
                zlevel:-1,
                nameTextStyle:{
                    fontSize:10,
                    color:"#fff"
                },
                offset:0,
                //min: 'dataMin',
                type : 'value',
                splitLine:{show: false},
                axisTick:{
                    show:false,
                    color:"#fff"
                },
                 axisLine:{
                    show:false
                },
                axisLabel:{fontSize:10,
                    inside:true,
                    color:"#fff"
                }
            },
        series : [
                {
                name:'buy',
                showSymbol:false,
                symbol:"circle",
                zlevel:-21,
                label:{
                    show:false,
                    distance:22,
                    color:"#fff",
                    fontSize:12,
                    align:"center",
                    verticalAlign:"middle",
                    backgroundColor:"#222E5D",
                    padding: [10, 15, 10, 15],
                },
                symbolSize:11,
                connectNulls:true,
                //step:true,
                emphasis:{

                },
                lineStyle:{

                },
                type:'line',
                itemStyle: {
                    normal: {
                        color: '#01C57B',
                        borderColor:'#01C57B',

                    }
                },

                areaStyle: {
                    normal: {
                        color: new echarts.graphic.LinearGradient(0, 0, 0, 1, [{
                            offset: 0,
                            color: '#00fd9d'
                        }, {
                            offset: 1,
                            color: '#141E46'
                        }])
                    }
                },

                data:arr1
            },
            {
                name:'sell',
                 showSymbol:false,
                symbol:"circle",
                label:{
                    show:false,
                    distance:22,
                    color:"#fff",
                    fontSize:12,
                    align:"center",
                    verticalAlign:"middle",
                    backgroundColor:"#222E5D",
                    padding: [10, 15, 10, 15],
                },
                symbolSize:11,
                connectNulls:true,
                //step:true,
                type:'line',
                stack: '总量',
                itemStyle: {
                    normal: {
                        color: '#D8195A'
                    }
                },
                areaStyle: {normal: {
                        color: new echarts.graphic.LinearGradient(0, 0, 0, 1, [{
                            offset: 0,
                            color: '#D8195A'
                        }, {
                            offset: 1,
                            color: '#141E46'
                        }])
                    }},

                data:arr2
            }
        ]
    };
    ;
if (option && typeof option === "object") {
    myChart.setOption(option, true);
}
window.onresize = myChart.resize;
教程就到这里,本文章只是简单的讲述一个实现的流程,作为参考,如果有更好的方法可以评论指出。
本文来自投稿,不代表本站立场,如若转载,请注明出处:https://www.ruletree.club/archives/2139/


